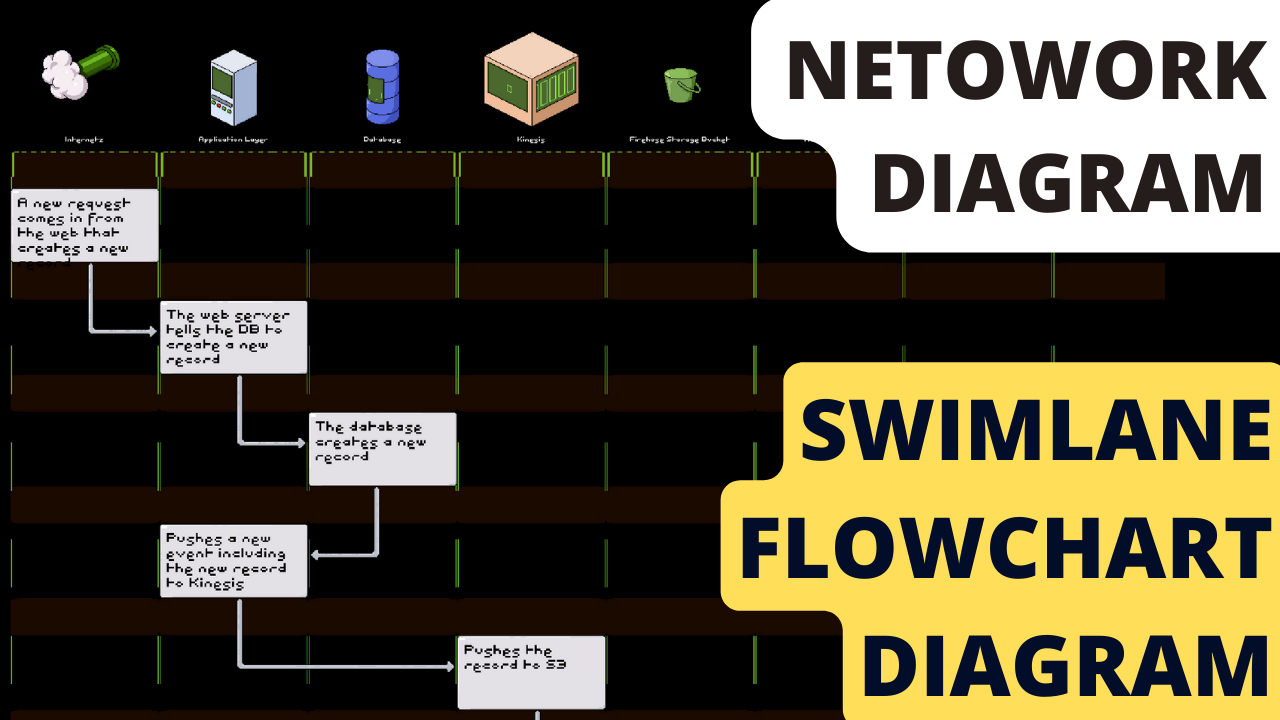
Software Architecture Diagramming 101: Swimlane Flowchart Diagrams

Another diagram that I frequently use to help communicate infrastructure designs and how they function to my clients is a Swimlane Flowchart. Why specifically a Swimlane Flowchart and not just a regular Flowchart? The Swimlane Flowchart allows me to group events by the actual service or piece of hardware(virtual hardware) that will be sending or receiving the event and draw out the interactions between multiple services in chronological order.
Now the interesting thing is that the resources/services that make up the individual Swimlanes are pretty much the same resources defined in our Network Map.
The real power of this communication medium is the ability to zoom out and view every interaction between every service and then zoom in to see how specific interactions will function. I even go as far as documenting the exact JSON,YML,SQL,etc payload that will be sent across the network from one service to another. It makes breaking down the system into Jira tickets and writing the acceptance criteria really easy.
If you are interested in playing around with the diagramming tool I use for my videos signup for the alpha waitlist here. I would love to have you test the bounds of this tool.
~Cheers
PS: If you are interested in engaging my services as a Web Application Architect check out my Group Coaching Program or 1 on 1 Consulting at schematical.com and check out my FREE eBook 20 Things You Can DoTo Save Money On Your Amazon Web Services Bill Today